Quickstart
Start Menu
To start the treatment of a request, select the Pending requests icon. The list of requests appears. Some filters situated above the list allows you to display only the specific kind of request wanted.
To continue the treatment analysis of a patient, select the Load interpretation icon. From here, you will need to navigate to the folder where you have saved the patient interpretation file (.tui) previously and you can reload it inside the application.
To start an analysis treatment with a new patient, select the New Patient icon.

1. Patients
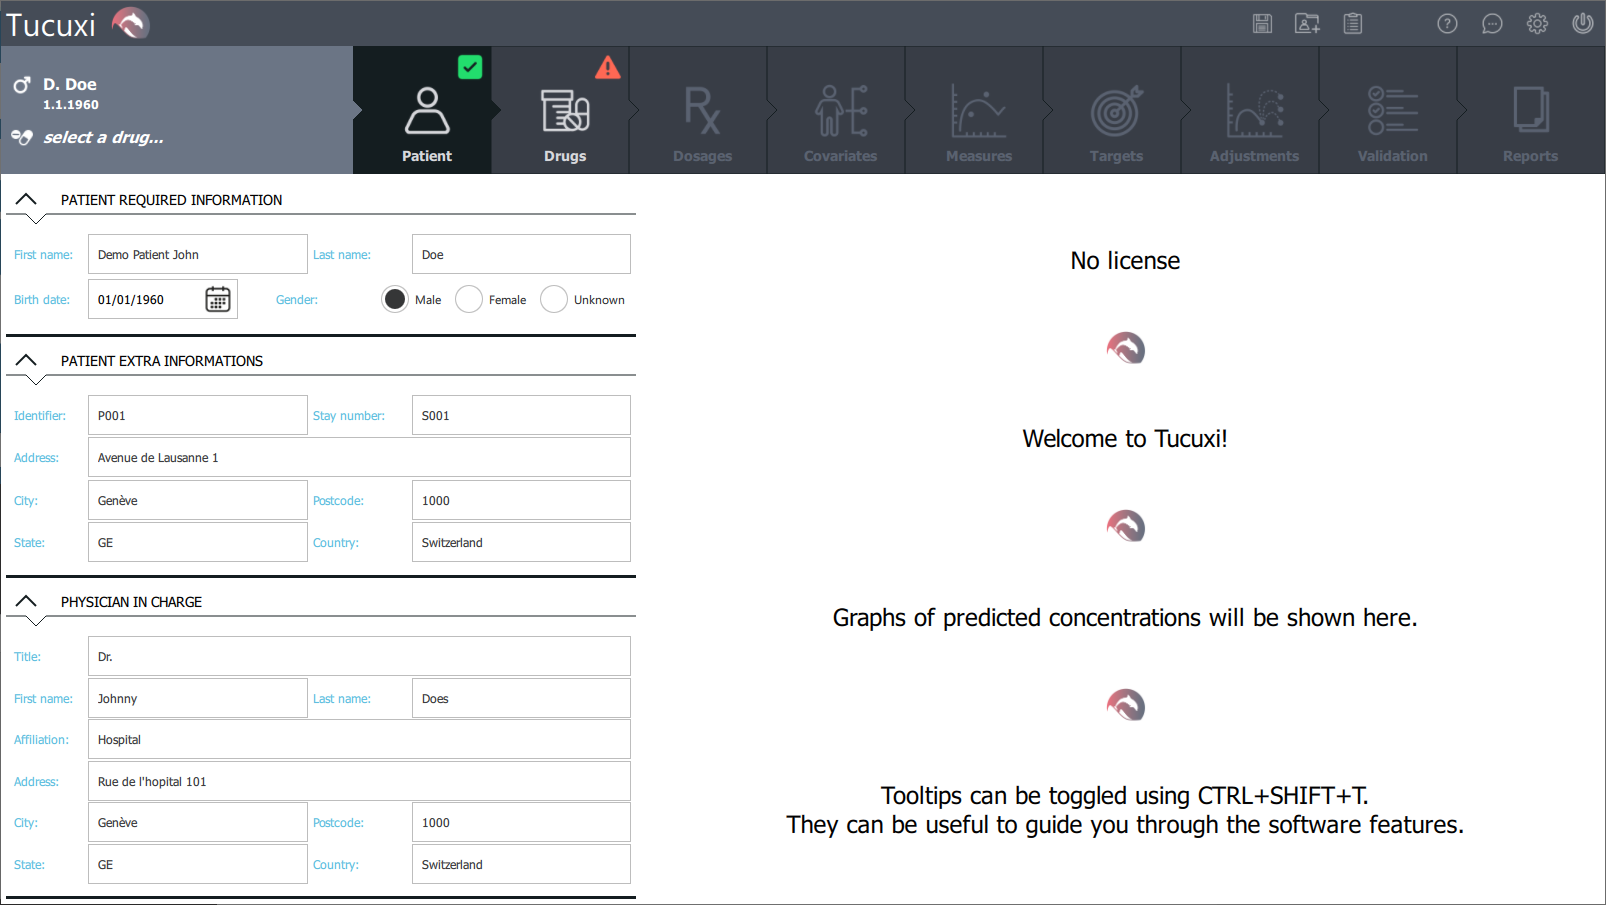
This first step displays and allows to register several informations about the selected patient.
To register the new patient, it is necessary to complete the Patient required information section. Extra informations can be provided in the sections below. Moreover, you can also indicate who is the physician in charge.
2. Drugs
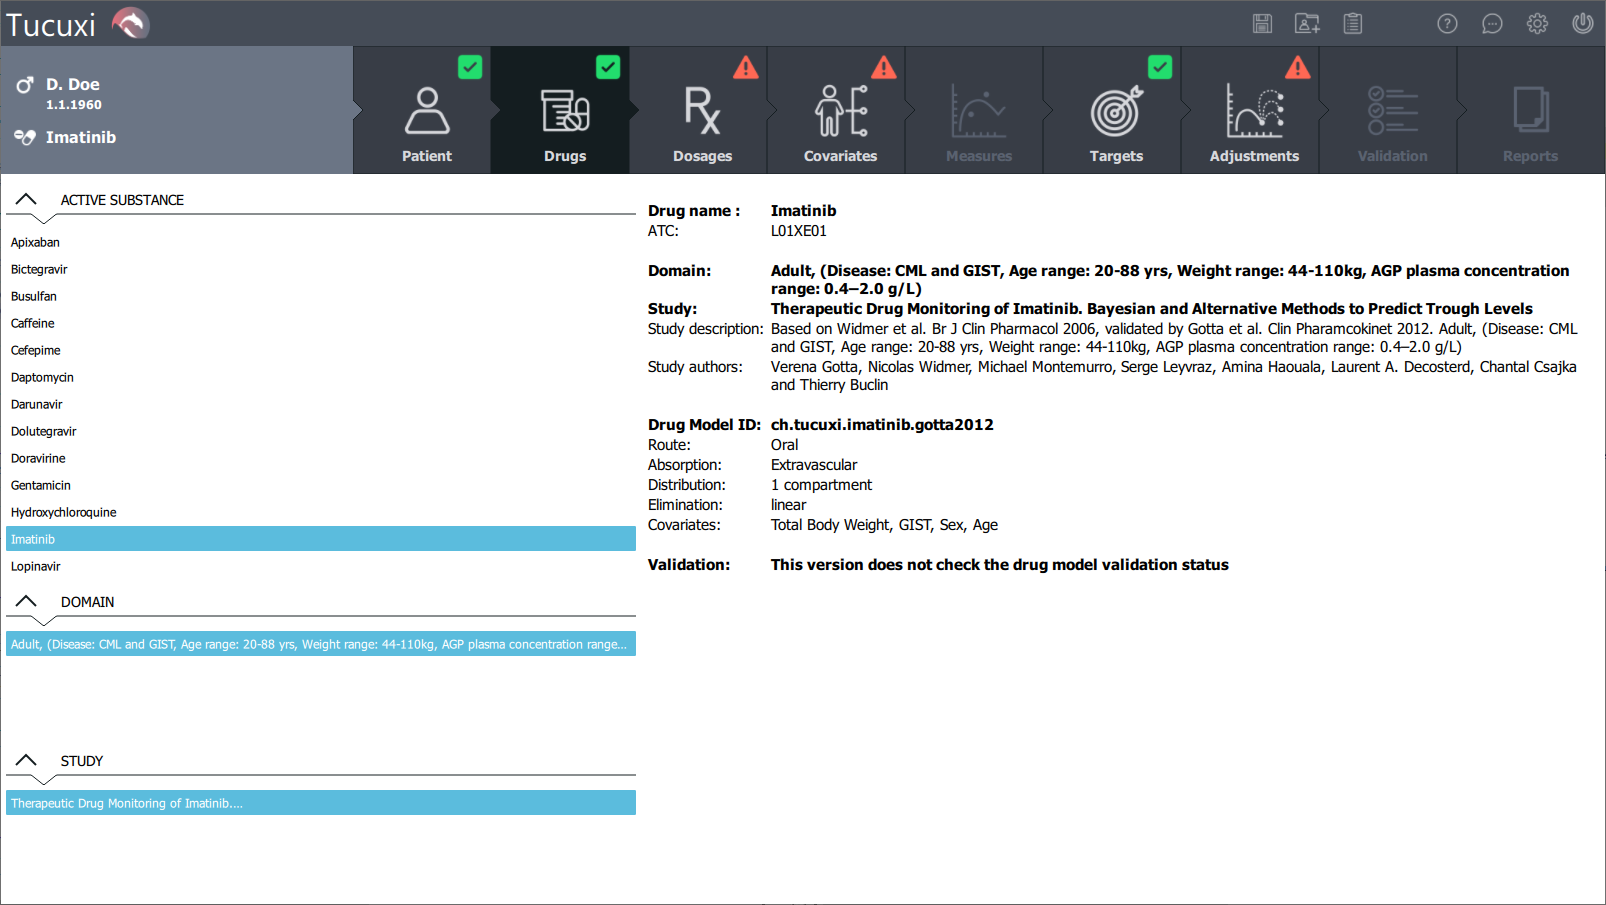
General informations on the drug used for the current analysis treatment is displayed here.
For a new patient, select the drug subject to the analysis under the Active substance section on the control panel. Informations on the Domain of the selected drugs will appear. The related study about the population pharmacokinetic model for each choice is also provided.
3. Dosages
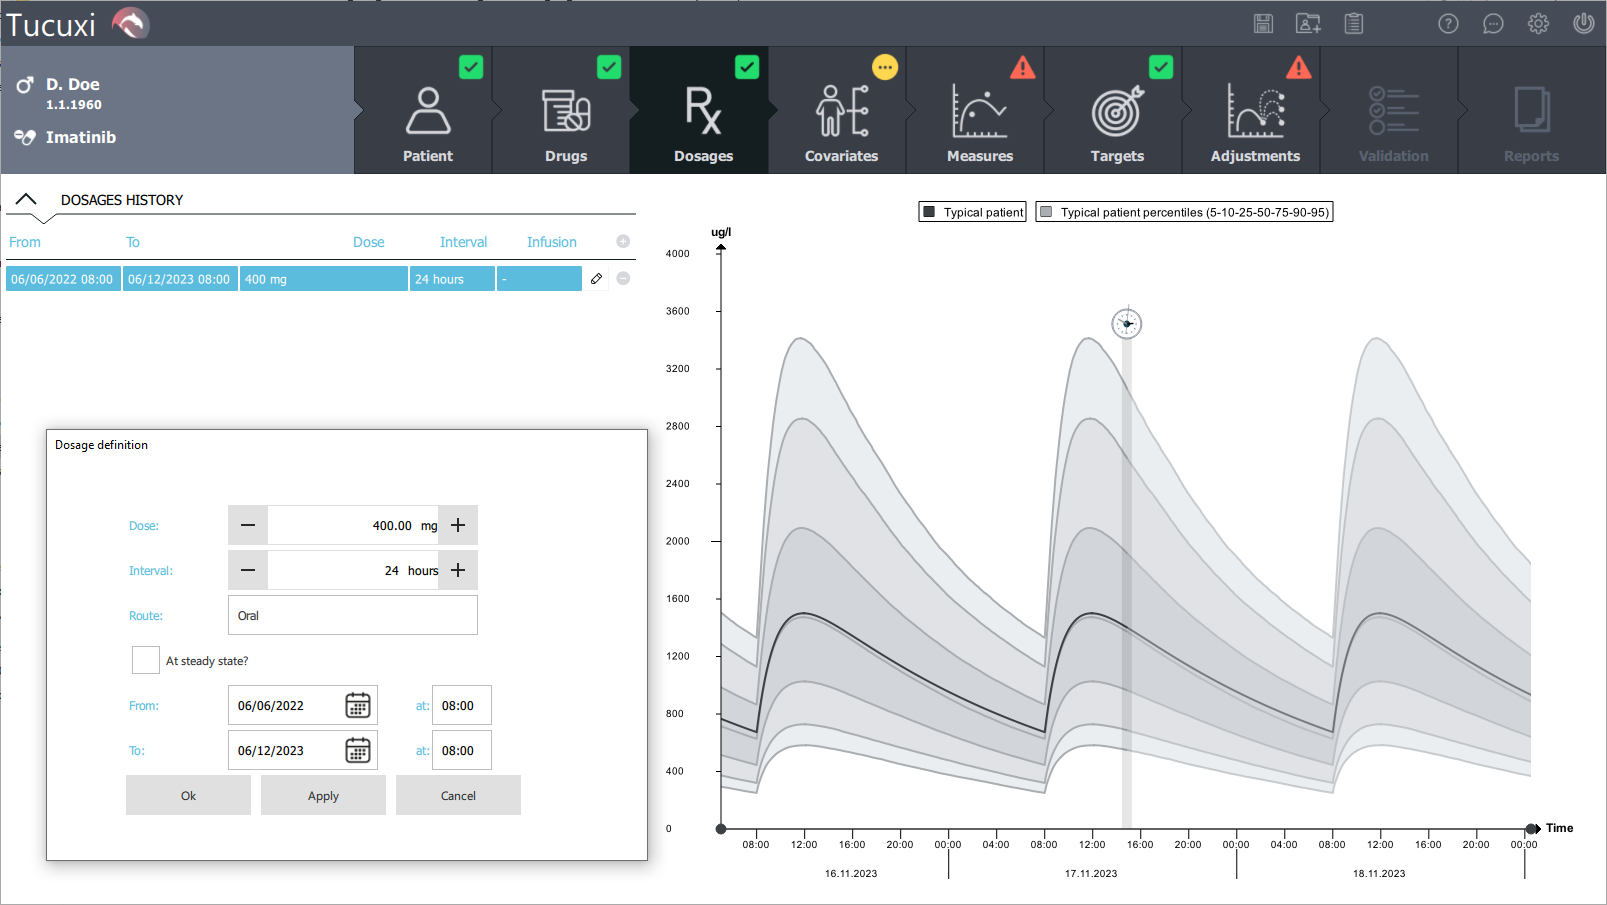
The Dosages history section on the control panel presents every dosage registred, previously given to the patient. On the graph panel, population percentiles are displayed. These percentiles describe the variability of blood drug levels expected in the target population taking into account the chosen dosage.
Go to the next step if no dose have been administrated to the new patient yet.
4. Covariates
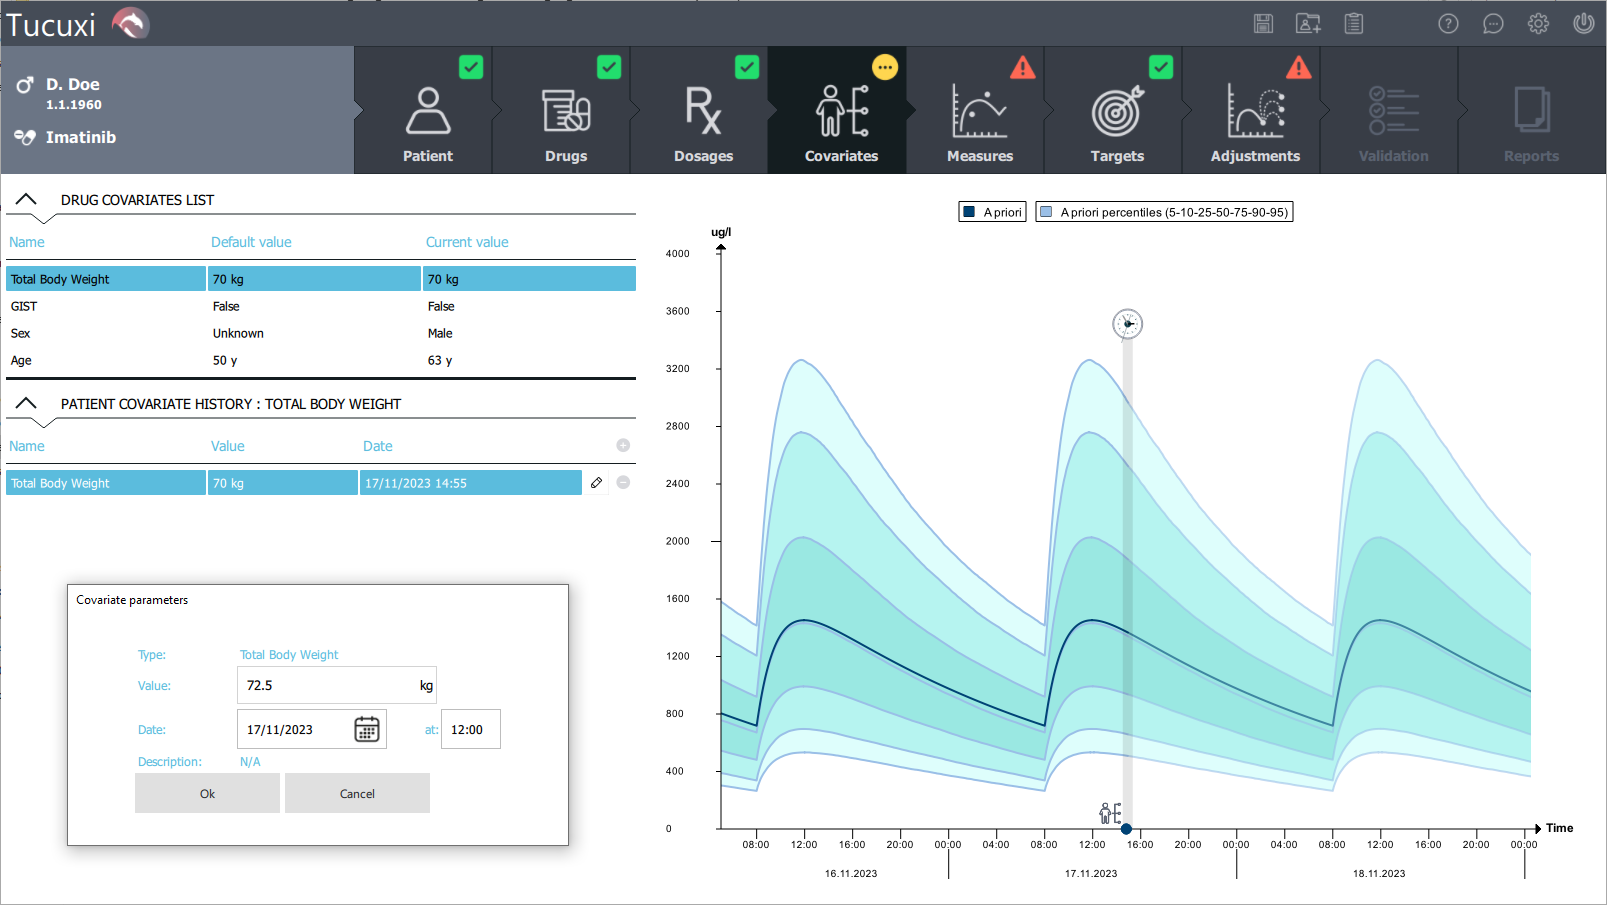
The Drug covariates list displays the list of every covariate relevant to the treatment analysis according to the study selected in the “drug” tab. Each selected covariate presents a Patient variate history situated in the section below.
Set a value for each covariate by selecting them in the list at first and then, click on the plus symbol in the right of the Patient variate history section. A window corresponding to the variate appears with the information fields to complete. If the patient is being registrated for the first time, each variate with no history must be set to complete the treatment analysis.
Apriori percentiles are displayed on the graph panel. These percentiles describe the variability of blood drug levels expected in a population that would have the same patient characteristics (covariate values), taking into account the previously chosen dosage.
5. Measures
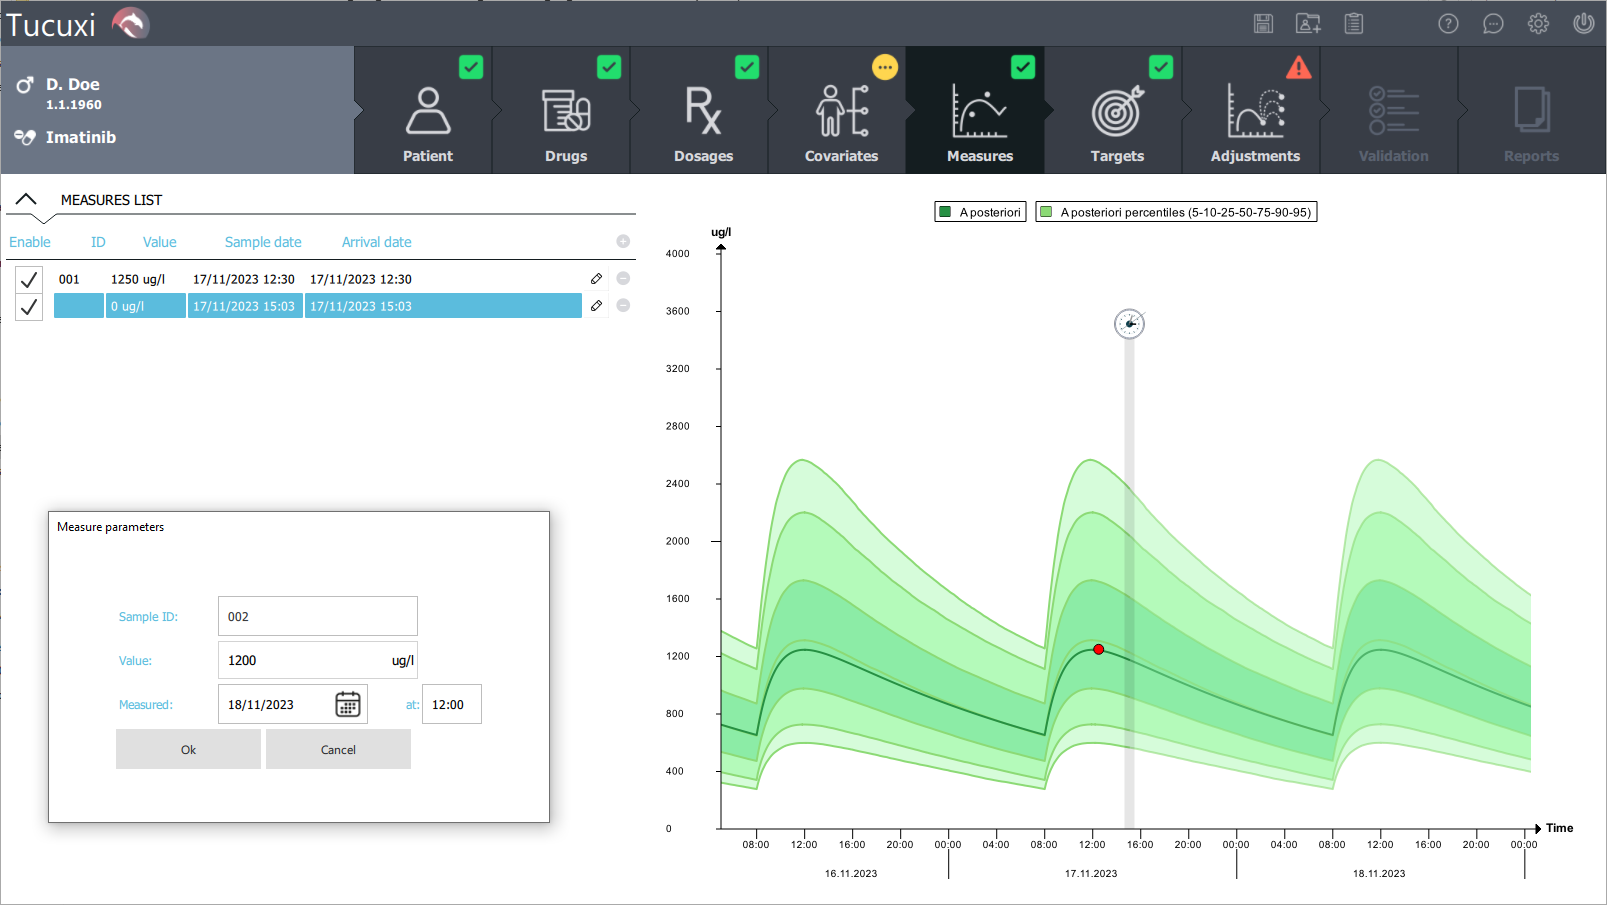
The Measures list allows to add the drug concentration of the sample subject to the analysis by clicking on the plus symbol on the top right corner of the list. A window with informations to fill will appear.
On the graph panel, aposteriori percentiles are displayed. These percentiles describe the variability of blood drug levels expected in a population that would have the same patient characteristics (covariate values), taking into account the previously chosen dosage and the blood level(s) measured.
Go to the next step if no measure of the analyzed drug concentration in blood has been done for the patient yet.
6. Targets
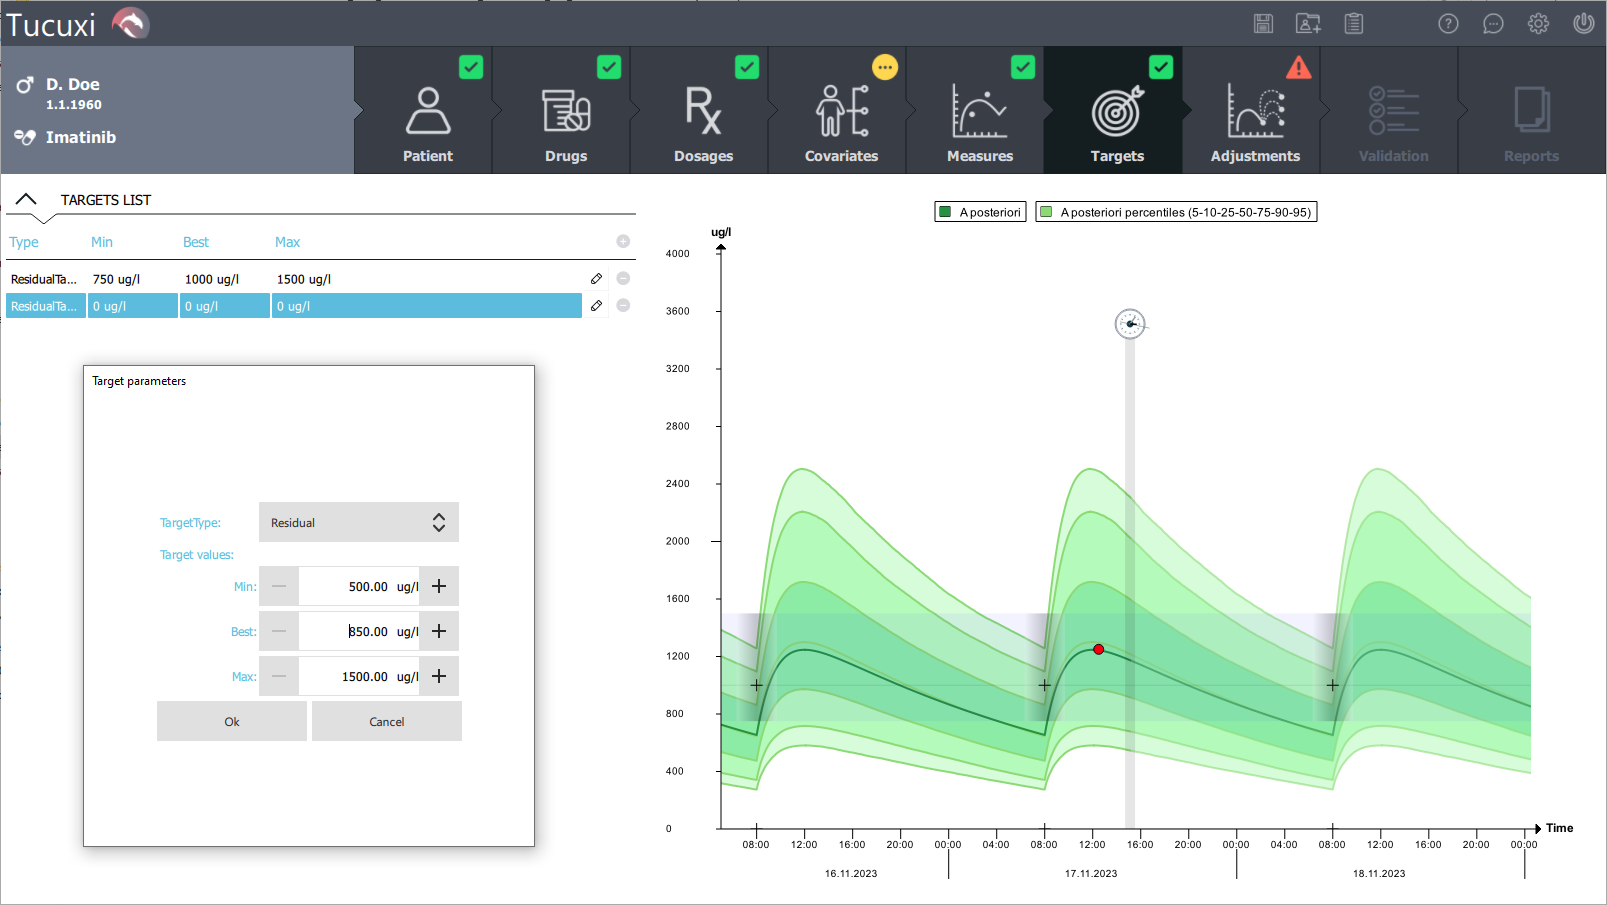
The Targets list displays the maxium, the minimum, and the best concetration to obtain for the patient according to the lastest informations found in the scientific literature. Those informations are editable with the pen symbol in the right of each target and additionnal target can be set with the plus symbol. A window with informations to complete will appear.
On the graph area, the ideal value of the target are indicated with black crosses and the interval between the minimum and the maximum value is shaded in grey if the residual, mean or peak target is selected.
7. Adjustments
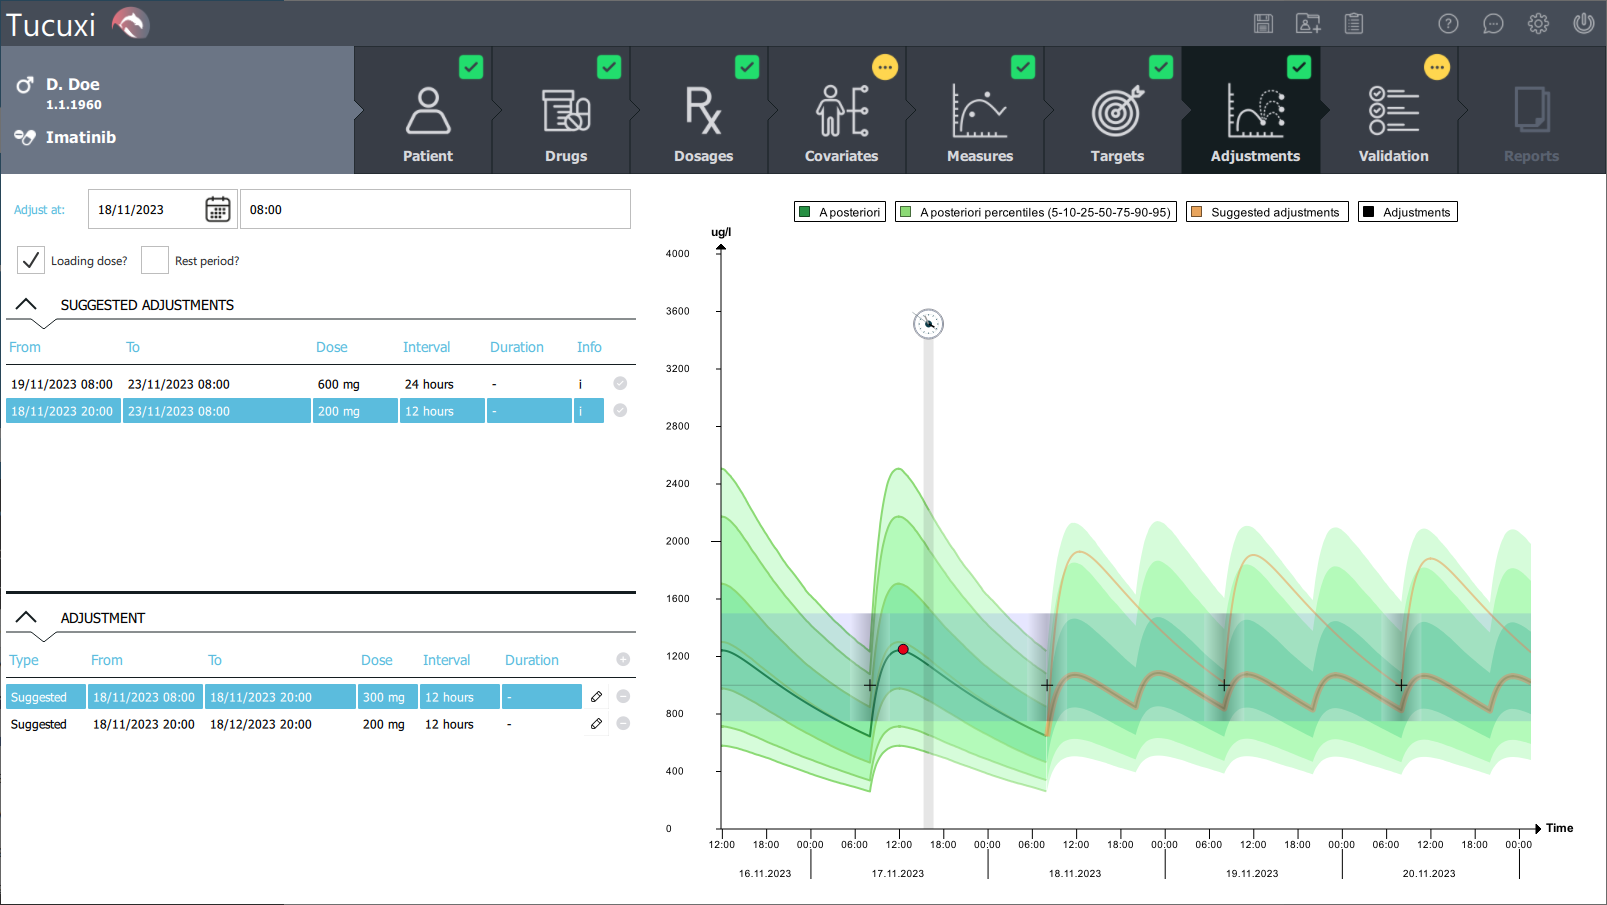
Suggested adjustments are listed in the first section. The Adjustment section below is used to set and displays the dosage of drugs to administrate to the patient.
A loading dose can be manually set by checking the box above the Suggested adjustment section. Likewise, you can set a rest period if you want to skip takes.
A suggested adjustment can be selected by clicking on the checked symbol on the right of the chosen dosage in the Suggested adjustments section
The date and hour of the time when the adjustment is made is shown and editable above the two sections.
Every expected curve of the adjustment is displayed in the graph area on the right panel.
8. Validation
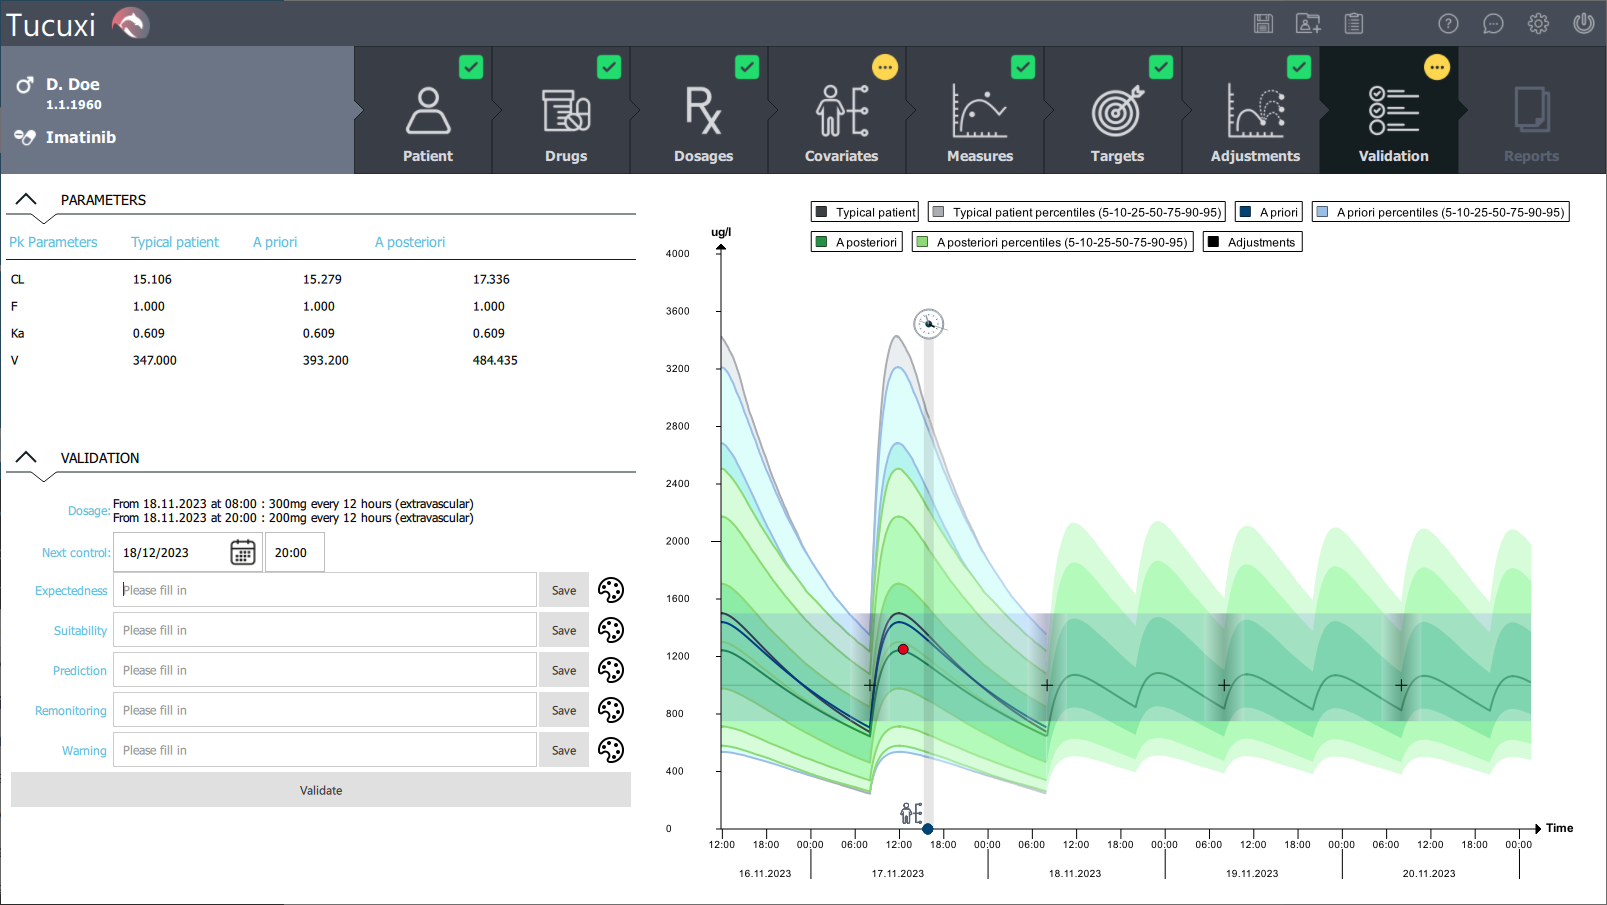
The Parameters section indicates informations about the parameters of the calculation model. The Validation section informs about the final dosage chosen and is used to comment the treatment. Click on Validate after the checking of every element to end the treatment analysis.
9. Reports
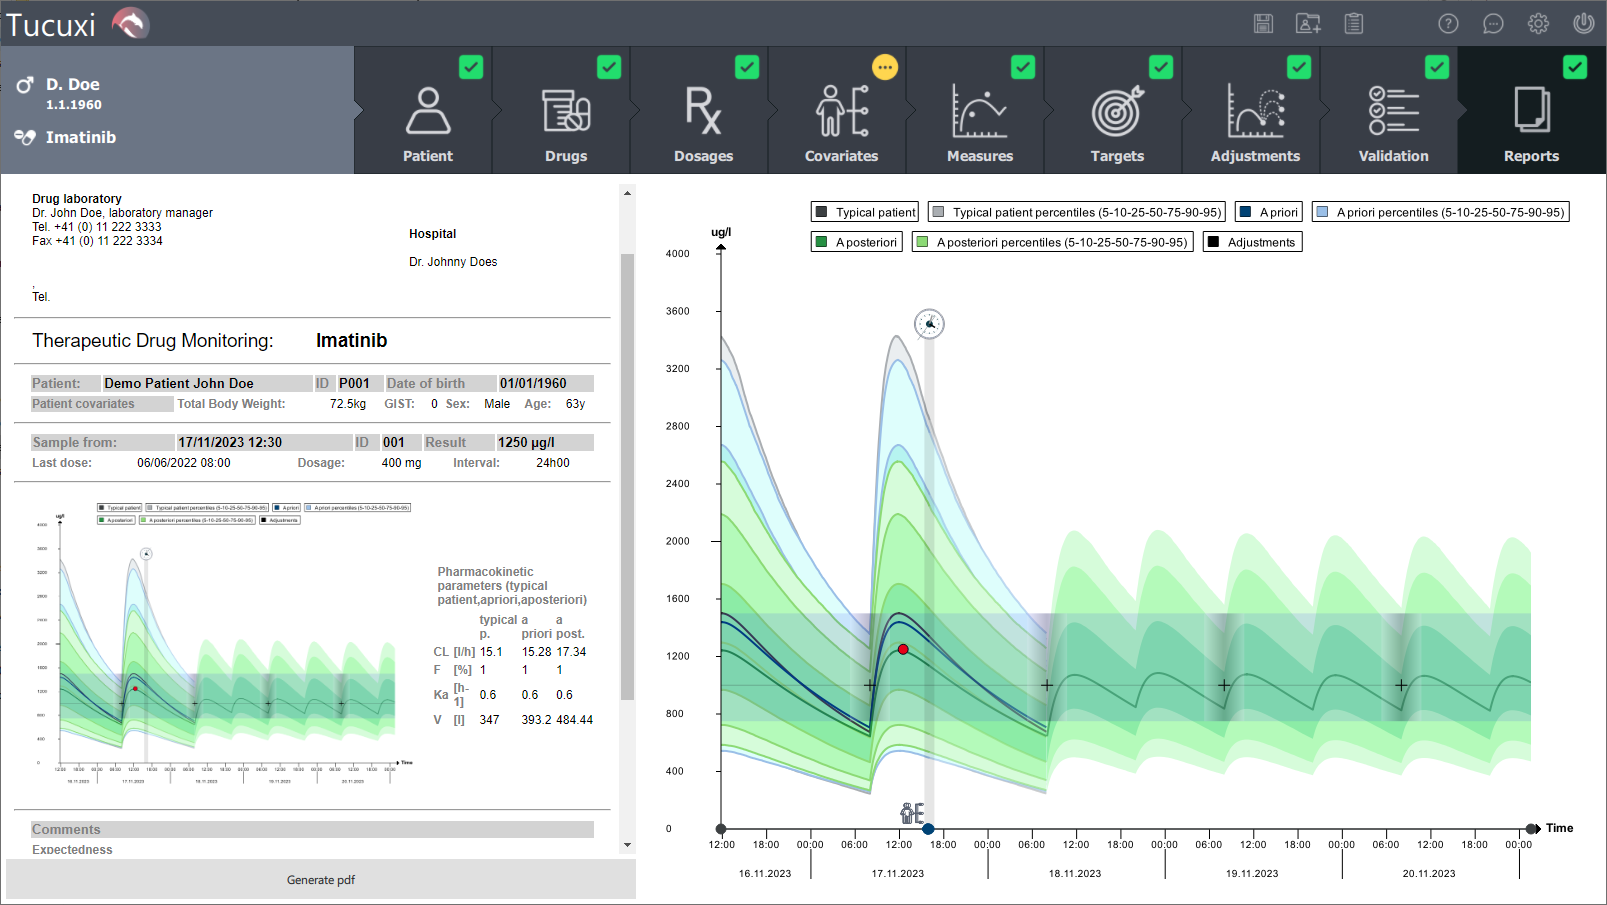
The final report of the treatment analysis is shown on the right of the interface, with every element needed. Generating a pdf is possible by clicking on the button below the report.